An expanded version of this article, along with many other customization examples and how-tos can be found in my book, SharePoint 2007 and 2010 Customization for the Site Owner.
This is an update of an article written for SharePoint 2007. Many of the steps are the same in both 2007 and 2010, but both the SharePoint Designer steps and the default web part used for views have changed.
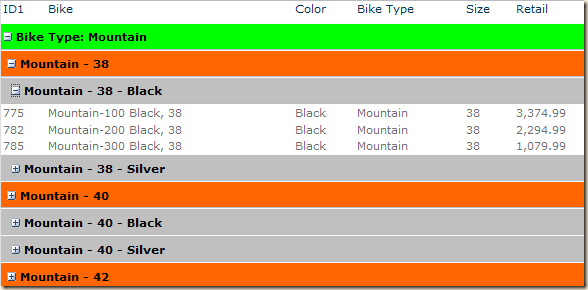
Group By on more than 2 columns in a view
In my SharePoint classes I have often been of asked how to group on more than two levels in a view. I have always given the quick answer of "use SharePoint Designer"!But, some of you have asked "How?". You may be sorry you asked… but here goes…
Goals:
- Create a view with nested groups deeper than just 2 levels
- Put the counts and totals at the bottom of each section.
- Do the above with no custom web parts, custom XSLT or anything that has to be deployed to the server.
Secrets and Tricks needed:
- It can't be done "out of the box" in the browser
- SharePoint Designer is needed to make the edits
- You need to convert the view web part to a SharePoint Designer Data Form Web Part
- You need a Sort and Group secret
- You need to fix the footer rows
- You need to manually add your totals, averages, counts etc.
SharePoint 2010 does not consider a page with a Data From Web Part to be a “view”. It only believes that a page is a “view” when it has an “Xslt List View Web Part”. In 2007 we could create a new view, edit it in SharePoint Designer as much as we wanted, and it was still a view. In 2010, SharePoint will not recognize a page without a XsltListViewWebPart as a view.
So before you start…
- If you just need a page with your list nicely grouped, it may be best just to create a web part page and store it in a library. Then add the Data Form Web Part using the steps below.
- If you want the page to be treated as a view, leave the XsltListViewWebPart on the page, but make it hidden. Then add the Data Form Web Part below the existing web using the steps below.
- In SP 2010, a view page with an added web part introduces a bug or two. The ribbon will not be displayed. The view dropdown in the page title area will be missing the dropdown to select another view.
My Example:
- I have a simple list (actually imported from Excel) with these columns: ID1, Bike, BikeType, BikeSize, BikeColor and Retail (price).
- I want to group this on BikeType, BikeSize, BikeColor and count the items and sum or average the price in each group.
Create a new Standard View from the list's view menu.
Don't bother with any options as we are just going to delete the default list web part.
Or just create an empty web part page. (see “Warning” above)
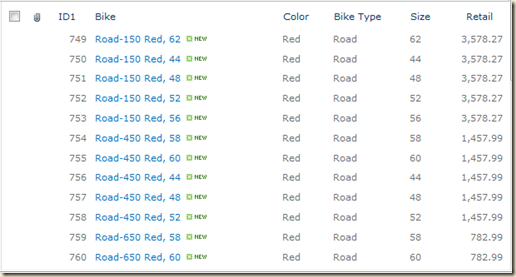
The “before” – just a standard view with selected columns:
Don't bother with any options as we are just going to delete the default list web part.
Or just create an empty web part page. (see “Warning” above)
The “before” – just a standard view with selected columns:

If using an existing view page:
- Open your site with SharePoint Designer and click the Lists and Libraries node in the Site Objects pane
- Click your list (“Bikes” in my example)
- Click your view you created earlier (“Grouped” in my example)
- Notes (background only, you can skip this):
- The view is now being displayed using a XsltListViewWebPart (It was a ListViewWebPart in SP 2007) and can only be customized with the same options as found using a browser ("Modify View")
- The XsltListViewWebPart has the same grouping limitations and the ListViewWebPart (2 levels of grouping)
- For more info on what has changed from the 2007 ListViewWebPart and the XsltListViewWebPart see http://msdn.microsoft.com/en-us/library/ff806162.aspx and http://msdn.microsoft.com/en-us/library/ff604021.aspx
- SharePoint Designer 2010 has two web parts for lists:
- XsltListViewWebPart - this is the web part used when you create a new View
- DataFormWebPart – created from SharePoint Designer using Insert, Empty Data View
- SPD 2010 adds a bit of confusion when trying to add a “Data View”
- When you click Insert, (pick an existing list) SPD inserts an XsltListViewWebPart
- When you click Insert, Empty Data View SPD inserts a DataFormWebPart
- The view is now being displayed using a XsltListViewWebPart (It was a ListViewWebPart in SP 2007) and can only be customized with the same options as found using a browser ("Modify View")
- If starting with an existing view, delete or hide the existing web part.
- Delete: In the Design window click in the web part, click the WebPartPages:XsltListViewWebPart tab, press the Delete key
or
in the Code window select the entire <WebPartPages:XsltListViewWebPart tag (including the start and end tags) and delete the code
- Hide: In the Design window click in the web part. In the Ribbon in the List View Tools section click the Web Part tab and then click Properties. In the Layouts section of properties click Hidden
- Delete: In the Design window click in the web part, click the WebPartPages:XsltListViewWebPart tab, press the Delete key
- Insert an Empty Data View Web part
- Click the Insert Ribbon tab and click the Data View button
- Click Empty Data View
- In the new web part click “Click here to select a data source”
- Click your list and click OK (this will open the Data Source Details Pane)
- Select the columns you want in your list (click a field, then Shift-click each additional field)
- Click the “Insert Selected Fields as” button and click “Multiple Item View”
Note: the view is now being displayed using a DataFormWebPart and:
- is no longer a “View” and can not longer be modified from the browser
- can be customized from SharePoint Designer,
- from the browser you can only rename the view,
- from the browser you can also use Site Actions, Edit Page, Modify Shared Web Part to hand edit the XSLT, ;-)
- going forward, columns added to the list will not be automatically added to the DataFormWebPart. You will need to use SharePoint Designer to manually add the columns to the “view’.
- Edit the Data View Web Part
- Click the web part and note that you now have Data View Tools section in the SharePoint Designer ribbon.

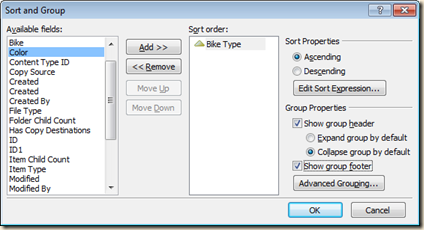
- Click “Sort and Group”
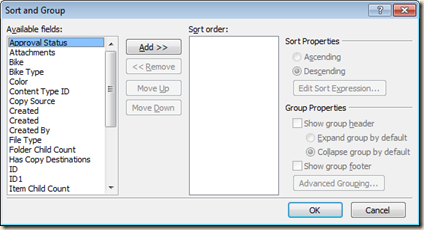
- Remove any sort fields that may already be in the Sort Order column
Add your top most group:
Add your second group by clicking the field (Example: Size) and clicking Add.
- If you stop here you will have groups, but all of your counts and totals will be wrong! We need to create both the text to display for the group and a hierarchy for the grouping. At the second level of our grouping we need to group on the combination of both columns, “Bike Type” plus “Size”
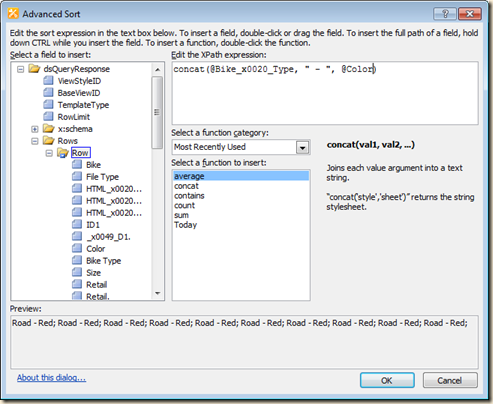
- Click “Edit Sort Expression”
- At a minimum you will need to concatenate the current grouping column with the previous grouping columns, and while you are at it you can add some “pretty” formatting:
- Enter: concat(@Bike_x0020_Type, " - ", @Size) (Watch the capitalization! Use the exact name the Intelisense offers – spaces are “coded” so “Bike Type” is “Bike_x0020_Type”.)
- Note the preview at the bottom of the dialog box…
- Click OK
- Click Show group header
- Click Collapse group (optional)
- Click Show group footer (if you want counts and totals)
For the third and following groups - repeat the step above with Sort Expressions similar to:
- concat(@Bike_x0020_Type, " - ", @Size, " - ", @Bike_x0020_Color)
- More columns? In each new group include all of the fields from the previous groups along with any separators you like:
concat(@group1field, @group2field, @group3field, @group4field, @group5field, etc)
or concat(@group1field, " - ", @group2field, " - ", @group3field, " - ", @group4field, " - ", @group5field, etc)
- If you could see the full width of these you would see:

Before clicking OK to leave this dialog box, check the order of the groups. They have probably gotten changed. (bug?)
- Make sure they are in order something like:
@BikeType
concat(@Bike_x0020_Type, " - ", @Size)
concat(@Bike_x0020_Type, " - ", @Size, " - ", @Bike_x0020_Color) - Recheck each of the sort levels to see if these are still checked:
- Click Show group header
- Click Collapse group (optional)
- Click Show group footer (if you want counts and totals)

Click the + to expand a section.
(click for bigger view)
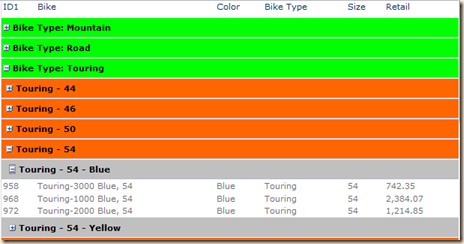
Now for totals!
- These steps describe adding totals to the footer rows, but also apply to modifying header (top of each group) rows.
- The Data View sets up the header and footer rows as a single cell with a column span of 99! To display totals in the same columns and the data you will need to fix these rows.
- You will need to fix each of the group footer rows plus the view footer row.
Now you need to do a little planning. In my example I'd like to put the "Count=" in a two column spanned cell under the ID and Bike columns. Then I would like to have one cell under each additional column. So something like: <td colspan='2'>count stuff</td><td></td><td></td><td></td><td>total goes here</td>

Steps:
Steps:
- Find "colspan="99"" for the first group footer row. (Tip: Did you find a header or footer row? Look up two lines and you should see "<xsl:if test="$showheader"" or "<xsl:if test="$showfooter""!)
- Change the 99 to 2
- Find the end tag for the cell (</td>) (down about 16 lines of html)
- After the end tag add the other cells (TD tag pairs), one for each additional column (I need four more)
<td></td> <td></td><td></td><td></td>
Now to add the total…
- Switch to Design view and you should see the new cells in one of the footer rows.
- Click in the cell where you want the total
- Right-click and select Insert Formula
- Build your formula. For a total double click "sum" in the function list then select your field from the dropdown list. My example needed: sum(@Retail)
- The formula editor does not know one extra piece of information needed here. The @Retail field needs to come from the current group only. To get this, update the formula like this: sum($nodeset/@Retail) ("nodeset" is all lower case)
Tip: How would you have discovered this? Go look at how they calculated the Count: count($nodeset). - Notice that the formatting is wrong. The total is left aligned and the wrong size. To match the font and size find the style used for the data in the row above. In my example it looked like this: <TD Class="{$IDADW3HE}">
- Copy the class info (Class="{$IDADW3HE}") into your total cell (the TD tag). The result will look something like this:
<td Class="{$IDADW3HE}"><xsl:value-of select="sum(@Retail)" /></td> - The last step is to right align the cell (you can use the toolbar button) and to format the total. To format the number, click in the cell with the total, right-click and select Format Item As… and pick your formatting options.
- Note: SharePoint Designer may get creative and merge your formatting in new styles with great names like style1, style2, style3 etc.. If you are curious, do a search for .style1 (dot style1) and you will find they have placed the style class definition in the PlaceHolderBodyAreaClass master page placeholder.
Now about the View Footer… and some things to make your head hurt…

- The View Footer is built in its own HTML table, so the column widths are not going to line up with the rest of the list. (I'll have to come back with another article to make these line up correctly).
- The grand totals need a special calculation to sum all of the rows. The @Retail field (or @yourfield) needs to come from the entire set of rows. To get this, update the formula like this: sum(/dsQueryResponse/Rows/Row/@yourfield) (make sure the capitalization is correct!)
Tip: How would you have discovered this? Go look at how they calculated the Count for the View Footer: count(/dsQueryResponse/Rows/Row) .
A lot of steps, but it's a fairly routine and mechanical process. Do it a few times and you to will be able to amaze your fellow site owners!
Hopefully the next version of SharePoint (2014?) will support more than two levels of grouping. Then we can all brag: "Back in the old days I had to … "
BUG!!!
There is a grouping bug in the Data Form Web Part… read the comments at the end of the original article for details. I hope to revisit that issue for 2010 shortly. If you want to go exploring in the mean time, here’s the fix for 2007..




34 comments:
Nice post is very useful, but I have a required, How Can I sort the groups by count value? Do you have any idea?
Best Regards and Thank you.
Thanks for this Mike!
I desprately need help with this...I have serached and tried everything I know.
I have come across a group count error. I have created a data view web part using a liked source. The DVWP has only one level of grouping: Date.
By Group Totals are incorrect (with the exception of the last group on the bottom). And my Webpart total count is correct.
I know very little about the code. But I have played with it to make some sense of it. I would appreciate if you can propose a solution.
I can't display a picture but my Data Veiw Web Part presently breaks down is something like this:
Date: 1/15/2012
Entry 1
Entry 2
Group Count: 0 (Wrong Count)
Date: 1/31/2012
Entry 1
Group Count: 0 (Wrong Count)
Date: 2/15/2012
Entry 1
Entry 2
Group Count: 2 (Right Count)
Total Count: 5 (Right Count)
What is frustrating is that all the group counts are based on the same formula then why are the first group counts wrong when the last one generates the correct value.
Group Count Code:
Count :
Total Web Part Total: This portion shows the correct value and uses:
I would greatly appreciate your help
ssvv,
The most common problem with grouping and group totals is the Advanced Sort XPath forumla. For my example above it was:
@Bike_x0020_Type
concat(@Bike_x0020_Type, " - ", @Size)
concat(@Bike_x0020_Type, " - ", @Size, " - ", @Bike_x0020_Color)
Notice that each level of grouping/sorting includes the data from the level above it plus the new level.
Your code did not display. To post code to blogger.com you will need to replace all of the "<" with "<" and all of the ">" with ">".
I am sorry I didn't realize the code didn't show up.
As I mentioned above the I have come across a group count error. I have created a data view web part using a linked source. The DVWP has only one level of grouping: Date.
My Group Totals are incorrect (with the exception of the last group on the bottom). And my Webpart total count is also correct.
The Data Veiw Web Part presently breaks down is something like this:
Date: 1/15/2012
Entry 1
Entry 2
Group Count: 0 (Wrong Count)
Date: 1/31/2012
Entry 1
Group Count: 0 (Wrong Count)
Date: 2/15/2012
Entry 1
Entry 2
Group Count: 2 (Right Count)
Total Count: 5 (Right Count)
What is frustrating is that all the group counts are based on the same formula then why are the first group counts wrong when the last one generates the correct value.
The code is as follows:
Group Count Code:
<xsl:template name="dvt_1.groupfooter0">
<xsl:param name="fieldtitle" />
<xsl:param name="fieldname" />
<xsl:param name="fieldvalue" />
<xsl:param name="fieldtype" />
<xsl:param name="nodeset" />
<xsl:param name="groupid" />
<xsl:param name="displaystyle" />
<xsl:param name="showfooter" />
<xsl:param name="showfootercolumn" />
<xsl:if test="$showfootercolumn" ddwrt:cf_ignore="1"> <t r valign="top" style="display:none">
<xsl:if test="$dvt_1_automode = '1'" ddwrt:cf_ignore="1">
<t h class="ms-vh" width="1%" nowrap="nowrap"></t h>
</xsl:if>
<t d class="ms-gb2 ms-altering" nowrap="nowrap">
Count : <xsl:value-of select="count($nodeset)" /></t d>
Total Web Part Total - This portion shows the correct value and uses:
<xsl:value-of select="count(/dsQueryResponse/soap:Envelope/soap:Body/ddw1:GetListItemsResponse/ddw1:GetListItemsResult/ddw1:listitems/rs:data/z:row)" />
I truly appreicate your help. Thanks.
I seem to be having trouble with Designer -- it offers me Rows to add, not columns....and if I cannot use "shift Click" -- it selects everything in between.
I would really love to get this working! Any clues to what I might be doing wrong?
You are AWESOME! :)Thanks a lot for the article.
Hi Mike,
I have been able to build a couple of dataform web parts from your sample. However I have a small question. Once we have a dataform web part in SharePoint Designer(SPD), your view in SP is gone. You will now have a page like http://pwd-abcd/Lists/mydemo.aspx
This page can be edited only in SPD, which is fine. But how do we publish this page with Dataform web part into a particular folder inside SharePOint site?
Right now I can just view the path of the file in SPD, these files reside under YourSite-->All Files-->Lists-->YourList-->mydemo.aspx.
I want to publish this file to SharePOint site as a Quick link so that my user can see the page with a link name(Demo1) which upon clicking shows my page. May be I am missing something very simple here? Thanks.
Hi Mike, this post is beyond helpful. Thank you. I have one final issue I'm trying to work through and hoping you know what I'm doing wrong. One of my columns is a calculated column that is formatted as currency. The Sum formula is returning as "Sum:NaN". Is the fact that it is a calculated column causing the problem? Do you know how I can fix this? Thank you in advance for any time and help you are able to offer.
mpmcarthur,
> Is the fact that it is a calculated column causing the problem?
No, it's the fact that it's formatted as Currency. Currency adds "$", "," and other non-numeric characters, so the result is not a number.
Mike
Hello Mike,
This is very useful post.
I have a question that, will this process work for lookup and cascaded lookup columns .
I am trying to achieve but facing issues.
yashgoley,
As the XSLT is just working on the displayed fields, it should work. What issue are you seeing?
Mike
I am getting the complete code in columns (when u see lookup columns in designer xslt view).
like :
And this is only for one column,,,, in each column I am getting this value
Would this work for multi-valued lookup columns as well?
I need to add accordion on grouping heading like:
http://jqueryui.com/accordion/
I am trying to add 'div' tags in xslt code but not getting work. not sure where to add 'head' and 'body' also. I am new to XSLT. Please let me know if this is possible or not.
Also, can you please let me know how to change the $imagesrc. I do not have access to _layout folder as I am working on SharePoint online
Hello, is it possible to group upon >2 Column Headers for External Lists based off of an External Content Type through BCS? I am attempting to insert an Empty Data View, however none of the External Lists are available to choose (just the default SharePoint lists that are created).
Thank You
Anonymous,
You can use the Data Form Web Part with external content types, but there's a little more work.
Basic steps:
1) Create a new data source:
Click Data Sources
Click SOAP Server Connection in the ribbon
Click General and give it a name
Click Source
Enter the URL to the list web service
http://sharepoint/sites/Training/_vti_bin/Lists.asmx
Set Operation to GetListItems
Click listName and set to the name of your ECT
Click the Login name and set the authentication options (try Windows first)
Click OK
Now add a DFWP to your page and select this new data source. The remaining steps should be the same as the article above.
Mike
Thank you so much! I had been searching for a soluiton to get the correct subtotals for the second level group for a long time, and very glad to find this. It is so simple.
Hello Mike Smith,
thank you very much for this tutorial, in appreciation to this, everything works fine, but what should i do, if the Fields are of type SPLookupField referencing to other SPLists on the same Website?
Considering this:
1)
the DataViewWebPart was a former XSLTViewWebPart of SharedDocuments-Library on a Website with content from SharedDocuments
2)
all steps of tutorial above done without errors
3)
DataViewWebPart as a WebPart deployed in globel WebPart-Gallery of the WebApp where the Website residents in through SPDesigner 2010
4)
added this DataViewWebPart on the SharedDocuments page as a WebPart
5)
XSLTViewWebPart of SharedDocuments is hidden and DataViewWebPart is beneath this (visible)
I have this situation and the DataViewWebPart mentioned in the steps above does not render the values of the former XSLTViewWebPart on page.
Instead the HTML-a-tag-referencies are rendered, and the expected "values" from the former "XSLTViewWebPart" aren't rendered (those one, which i selected as a data source to use for the DataViewWebPart from SharedDocuments).
Setting the former XSLTViewWebPart to visible and the DataViewWebPArt to hidden, and referncing content retrieval form the XSLTViewWebPart does not do the magic of grouping the XSLTViewWebPart with multible groupings.
Any ideas why i'll get the html-a-tags instead of the values ?
Yours sincerly,
H.Emrah Kayaman
Very Nice Tutorial.
This Solution works fine, until you don't make use of SPLookupField-Types.
In that case the rendering will not fail, but the complete Lookup-Reference will be rendered.
Consider: @Bike_x0020_Type and @Size to be SPLookupFields
then:
-----
concat(@Bike_x0020_Type, " - ", @Size)
would be rendered as
- ""Value of @Bike_x0020_Type""
If you would like to avoid this, but showing only the Values of those SPLookupFields, do this instead:
concat(substring-before(substring-after(@Bike_x0020_Type '<'), '>'), " - ", substring-before(substring-after(@Size, '<'), '>'))
so for the whole thing:
-----------------------
@Bike_x0020_Type
concat(@Bike_x0020_Type, " - ", @Size)
concat(@Bike_x0020_Type, " - ", @Size, " - ", @Bike_x0020_Color)
it goes like this:
substring-before(substring-after(@Bike_x0020_Type, '>'), '<')
concat(substring-before(substring-after(@Bike_x0020_Type '<'), '>'), " - ", substring-before(substring-after(@Size, '<'), '>'))
concat(substring-before(substring-after(@Bike_x0020_Type, '<'), '>'), " - ", substring-before(substring-after(@Size, '<'), '>'), " - ", substring-before(substring-after(@Bike_x0020_Color), '<'), '>')
Attention:
----------
I have just added quotas to the a-html-tag in order to subscribe this code here, in nature there are no quotas placed on that a-tag!
BUT >>>> the rendered view is without any refernce, you cannot click the lookup-reference, how to do that inside a XSLT-transform-manipulated DataFormWebPart like here??
Greetz
Hayri Emrah Kayaman
Awesome Blog. Can't thank you enough!! Worked perfectly. Needed to change some of my number values to text to get the sums to work properly because of the commas, but after that it was a perfect description- THANKS!!!!
Hayri,
Thanks for your comments.
As far as the tag brackets... in blogspot site comments you can enter displayable <, > symbols by typing < and >.
> "you cannot click the lookup-reference, how to do that inside a XSLT-transform-manipulated DataFormWebPart like here"
I think have that documented in my SharePoint Designer class (55010A)...
Something like this:
<a>
<xsl:attribute name="href"><xsl:value-of select="@URLcolumn"/></xsl:attribute>
<xsl:value-of select="@DescriptionColumn"/>
</a>
Mike
Hi Mike,
I added empty data view and added three level grouping but I am missing to get ECB context menu on the Name field of the library. How to get ECB menu in Data form webpart in SPD 2010. please reply knowsharepoint@gmail.com
Is there a 2013 version of this article yet?
Jason,
No, not yet. It won't be as easy in 2013 as they "broke" SharePoint Designer 2013 and removed the Design view that's pretty much needed for the edits.
I'll see if I can find a work around.
Mike
Waiting for the 2013 version.. Sucks they removed the designer view
Hi Mike,
This is awesome. I'm just having an issue with my group count so I think you could help me. I have 3 groupings in my view, grouped by Year, by Month and by Supplier. When I have the footer option checked for Year, the count is correct. However, when I also enable the footer for Month, the results or counts are incorrect. Any suggestion how can this be corrected?
Thanks in advanced,
Arnel
Hi Mike,
thanks for the steps. I've achieved the grouping. However, now I want it to viewed by users as well. Since it is no longer a view now, how do I present this grouped data to users so as it seems to them this is a part of this list itself.
Also where will this page be stored in the Sharepoint site?
This is a great post and has saved me hours of coding - thank you so much!
Just a quick question - how do I convert one of the columns I'm displaying (not a grouped column) to act as a link to open the item? I'm using this in SPD 2010 and although I can display the URL Path of the item as a column its not very pretty!!
Thanks
Anonymous,
Add the column named something like "Name (linked to document)" or "Title (linked to document)".
This is usually the first text column in the list.
You can also edit the XSLT of the web part to make any column a clickable link. I think I have a blog article showing how... I'll just have to find it!
Mike
To change any column to a hyperlink to the list item:
<a href="{concat(@FileDirRef,'/Forms/DispForm.aspx?ID=', @ID)}">
... content to display is here ...
</a>
Hi,
I had a requirement for grouping on 5 levels and this solution is working perfectly when all 5 metadata have values. However in a case when one of the metadata is not having a value (lets say only 4 metadata are filled and 5th is blank), then the item still appears under the 5th grouping rather than under the 4th. Can you please advise me here.
This post is still invaluable in May of 2017! Thanks for sharing Mike.
My issue is after performing all of the steps, everything works well except, I would like to sort descending on my first column and it just won't do it whether I choose ascending or descending it stays on ascending. Glitch?
Also, I wonder if there is a way to hide the sort expression words. For example, I don't want to show State - Region - Address for the "Address" section. but I need the expression there to force the count to work. Is there a way to include the expression but not have it print?
Thanks again for your help!
Post a Comment